
Why QGenx
Why Qgenx Prism: how it works, start to finish.
Prism turns imported and recorded product, store, sales, returns and stock data into pivots, comparisons and merchandise views, so the question is answered in one place. It analyses data you have recorded; it is not a live checkout or a purchasing system.
01 Ask
What we ask before we configure anything
Reports are answers. We start from your questions.
We start with questions, not features. Every answer changes a setting.
- Which questions does management ask every week?
- What data do you record today, and in what files?
- Which stores, brands and channels do you compare?
- Who rebuilds the reports by hand, and how long does it take?
- Which views would change a buying or markdown decision?
02 Map
From your question to a Prism view
Each question becomes a pivot or a report.
| Your problem | How Prism is set up |
|---|---|
| Which stores underperform? | Retail pivots and period comparisons |
| What is not selling? | Inventory health and stock-to-sale |
| Where are size runs broken? | Size availability and refilling review |
| Which online returns are risky? | Return risk and ageing |
03 Configure
Set up and load
Data first, views next.
- Product, store and attribute setup
- Marketplace and category setup for ecommerce
- CSV imports of sales, returns and stock
- Users and roles for who sees which report
04 Pilot
One month of data
We prove the numbers before anyone relies on them.
- A real month imported
- Totals compared with your own reports
- Pivots adjusted to match how you slice
- Downloads reviewed by the analyst
05 Result
What you can see afterwards
Reports built for operating questions.
What you can check afterwards, in records you can audit.
- Retail and ecommerce overviews
- Period comparisons by any slice
- Gaps, returns and ageing
- Datasets to download
Related
More on Prism
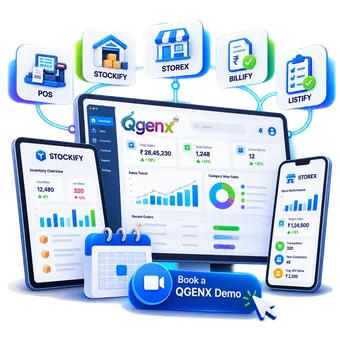
QGenx demo
Walk through Prism with your own data.
Tell us about your current workflow, look at the product closest to the problem, and choose a 30-minute slot. A working walkthrough, not a slide deck.
- 30 minutes
- Your workflow, not ours
- No obligation