01
Business-first brief
Start from the decision, bottleneck or recurring workflow, not from a generic service package.
QGenx frames every managed service as a working studio: each offer has a business brief, method, proof layer, delivery cadence and measurable operating output.
This index uses issue metadata, side rails, annotated art, capability cards, method steps and proof sections to make QGenx services feel concrete, owned and high-trust.
Start from the decision, bottleneck or recurring workflow, not from a generic service package.
Every engagement has a clear owner, output, cadence, review path and delivery expectation.
Dashboards, reports, decks and pages need evidence, traceability and business clarity before decoration.
Inputs, tools, people, approvals and final users are mapped before the artifact is built.
Browser access, simple handovers and message-based reminders make the service easy for Indian SMB teams to actually use.
Reports, reconciliation outputs and data work are structured so finance and leadership can review them confidently.
Services do not end at first delivery; changes, fixes and recurring updates are built into the model.
Automation is paired with review so outputs are not only fast but also credible and usable.
Every service points to a visible business outcome: time saved, accuracy improved, pages launched or decisions clarified.
QGenx builds, hosts, and maintains your business dashboards so your team always has live, accurate numbers without chasing spreadsheets or waiting for reports.
↳ Your data exists. The problem is seeing it.
Connect POS, ERP, WMS, spreadsheets or APIs into one coherent reporting layer instead of switching between five disconnected tools.
Dashboards are laid out around real workflows, so store managers, CFOs and founders each see exactly what they need.
Refresh data hourly, daily or near real-time so every review starts from current numbers, not last Tuesday's export.
Owners see everything while departments only see their slice, keeping sensitive metrics protected.
New KPIs, schema changes and new product lines are handled as part of the engagement, not as a fresh project.
Boardroom-ready PDF, Excel or screenshot exports can be sent on schedule by inbox, shared drive or dashboard export.
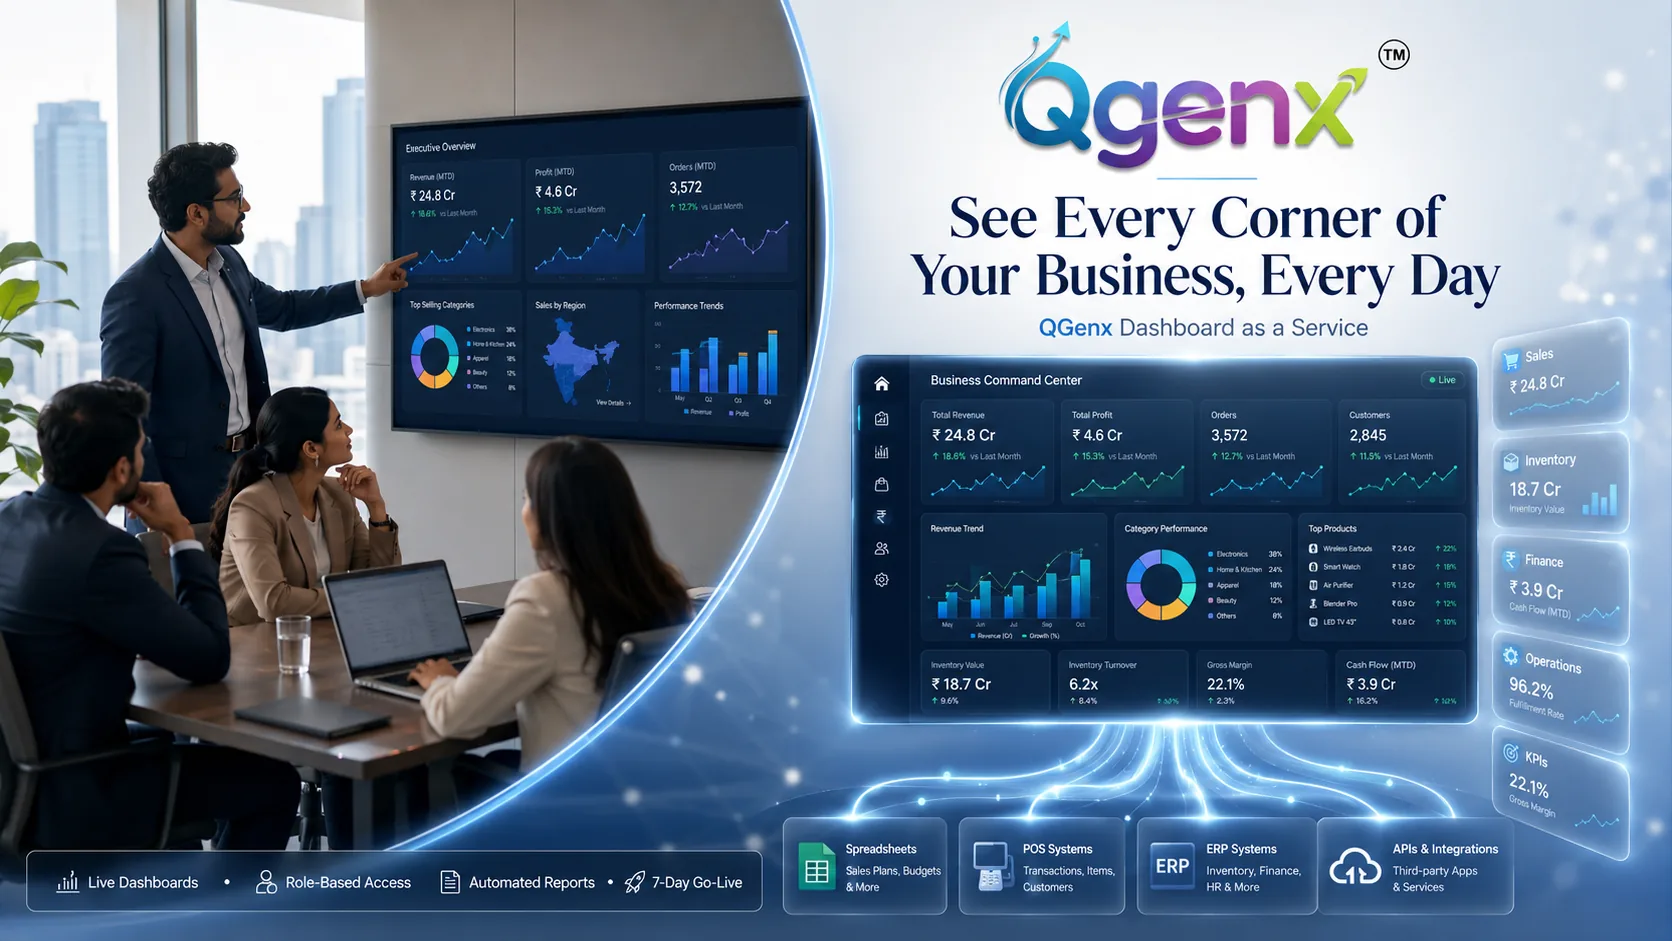
50+ dashboards delivered · Avg. go-live in 7 days · 100% client data ownership
Retail and multi-store brands · Clarity
QGenx helps growing teams create polished, persuasive and brand-aligned presentations without overloading internal teams. From investor decks to sales proposals and board updates, raw content becomes a clear story that moves decisions forward.
↳ Professional presentations without the internal bottleneck.
Shape raw notes, data and ideas into a clear presentation narrative that explains context, opportunity and action.
Apply your colours, typography, visual style and tone so every deck feels consistent and professional.
Turn dense numbers, tables and performance updates into readable charts, dashboards and executive summaries.
Plan urgent delivery for board meetings, pitches, proposals and internal reviews with clear timelines.
Restructure, clean up and upgrade existing presentations when the material is ready but the deck is not.
Create a recurring presentation workflow for teams that build decks every month.
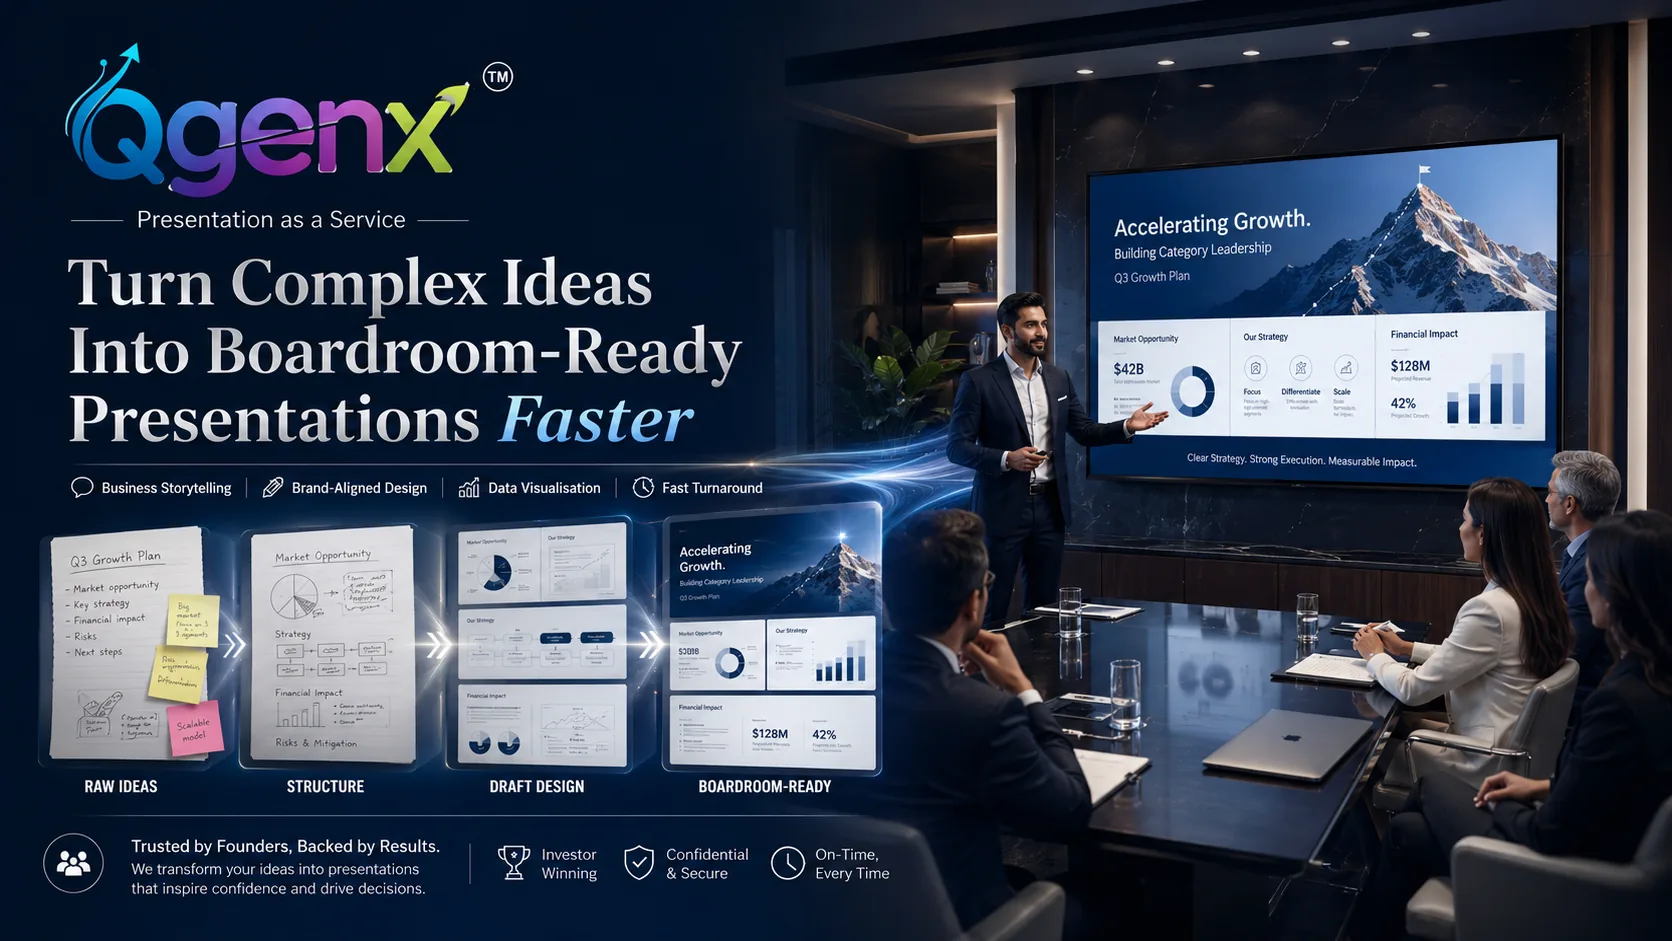
Brand-aligned delivery · Strategy-led slide design · Fast turnaround options
Founders and leadership teams · Deck Sprint
QGenx takes full ownership of fragmented pipelines, unreliable records and shadow spreadsheets so teams work with clean, consistent and governed data every day.
↳ One partner. Complete data ownership.
Identify duplicates, incomplete records and inconsistent formats, then document the cleansing rules.
Connect CRM, ERP, warehouses, legacy databases and spreadsheets into one unified view.
Define owners, access rules, retention policies and lineage so every dataset has accountability.
Run scheduled quality checks and flag anomalies before they reach dashboards or reports.
Maintain one master record for customers, products, suppliers and employees across departments.
Prepare data in the exact structure your BI tools, dashboards and finance models expect.
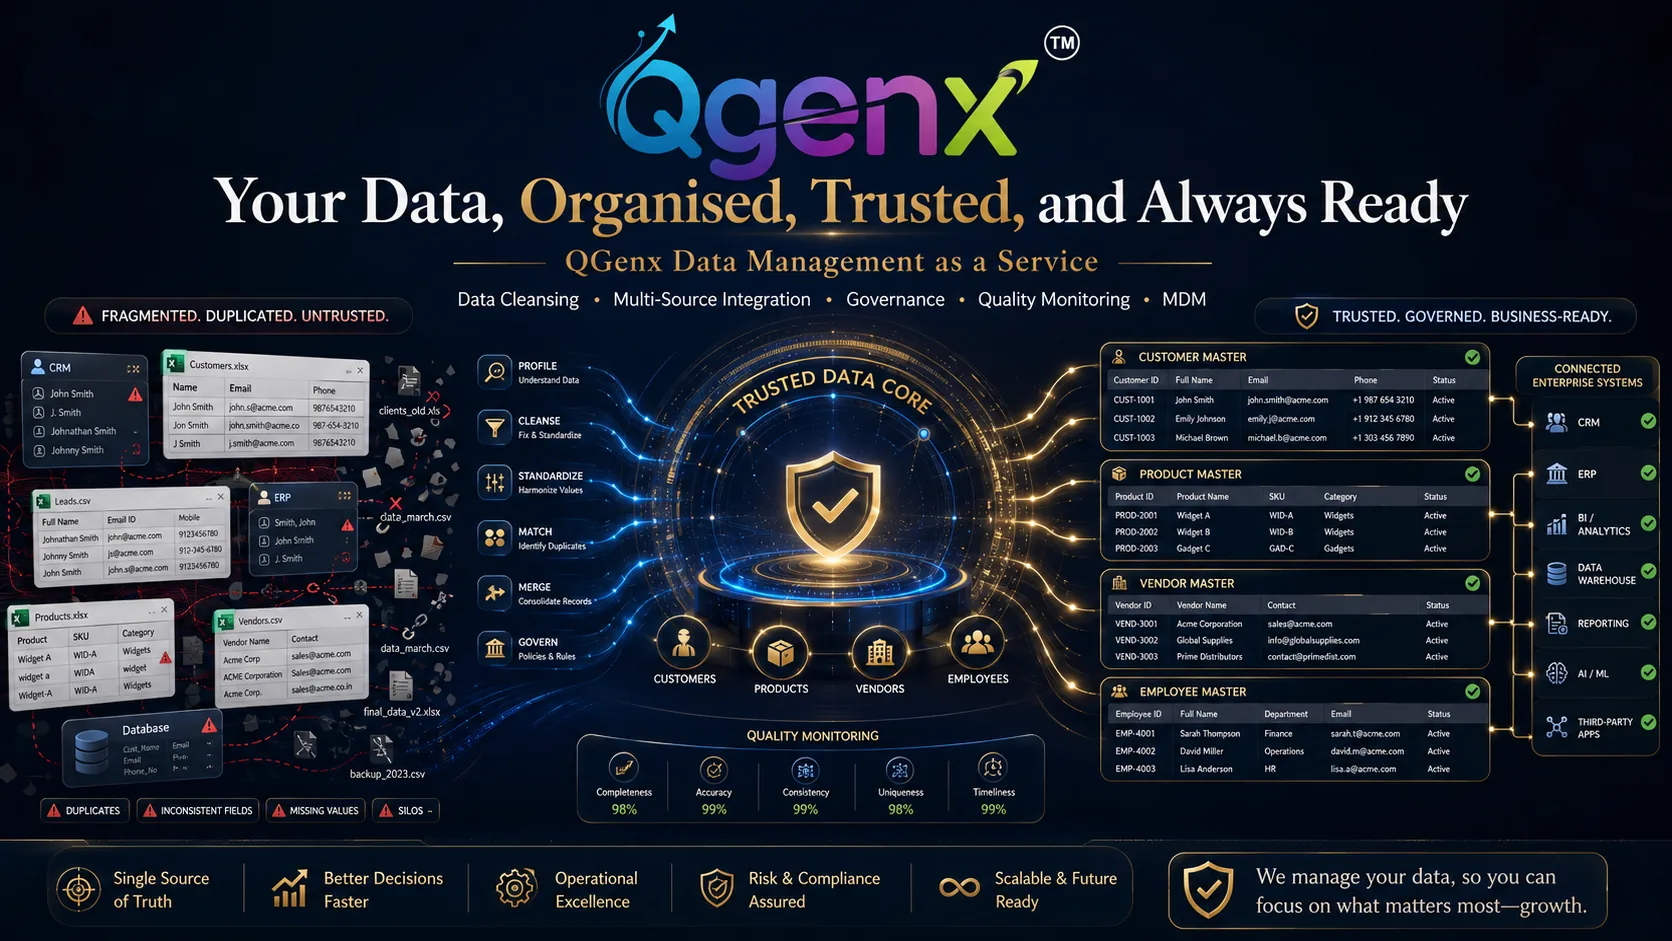
350+ clients served · 99.7% data accuracy SLA · 72 hrs average onboarding
Mid-market B2B businesses · Foundation
QGenx bulk renames, converts, resizes, compresses, upscales, organises and quality-checks large image libraries in one managed workflow.
↳ Every image operation. One managed service.
Convert messy camera names into structured, searchable naming systems.
Convert JPG, PNG, WebP, AVIF and other formats based on channel requirements.
Resize images for marketplaces, product catalogues, web banners and social placements.
Improve low-resolution assets where appropriate while keeping QA in the loop.
Compress and optimise files for faster pages without destroying visual quality.
Organise EXIF, SKU, folder and catalogue metadata so images stay traceable.
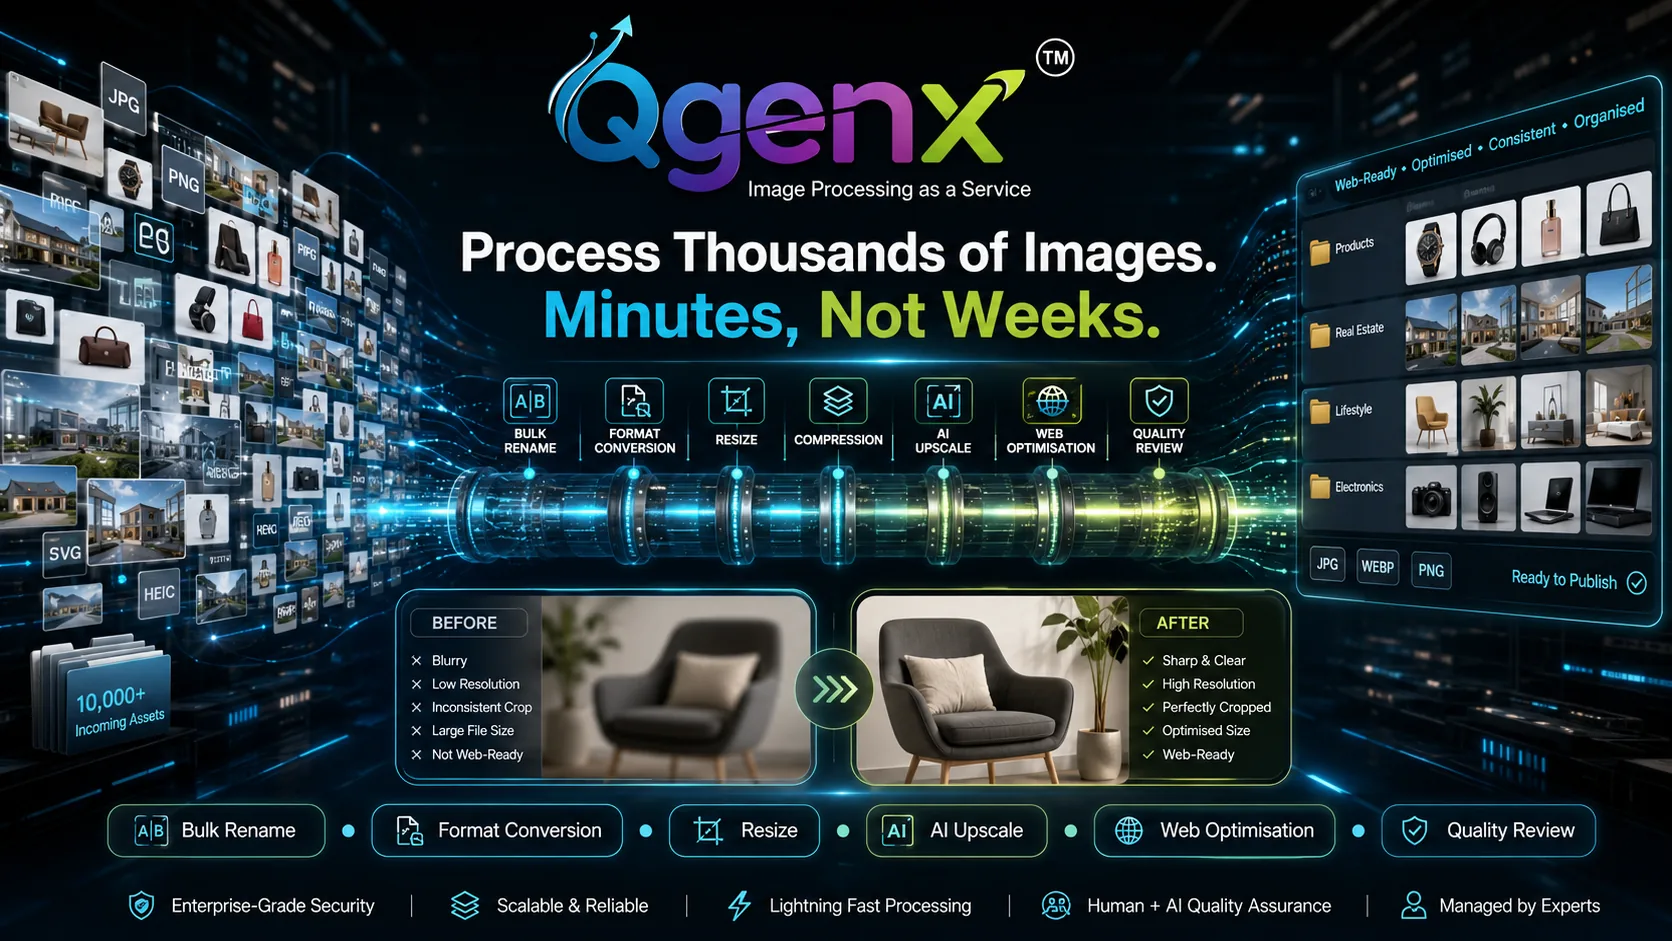
10M+ images processed · 98% output accuracy rate · 48hr average bulk turnaround
E-commerce and retail businesses · Batch Pass
QGenx builds business websites designed around your customers and goals, not just how they look on a designer's screen. Every site is SEO-structured, mobile-ready and built to perform from day one.
↳ Your business deserves a website that actually works for you.
Structure pages, headings and content around how customers search before design begins.
Test layouts, buttons, text and forms across real mobile screen sizes and orientations.
Compress images, minimise code and target fast mobile load times.
Guide visitors toward enquiries, bookings, calls or purchases with clear information hierarchy.
Set up GA4, Search Console and conversion tracking before handover.
Give your team a manageable way to update pages, posts, prices and phone numbers.
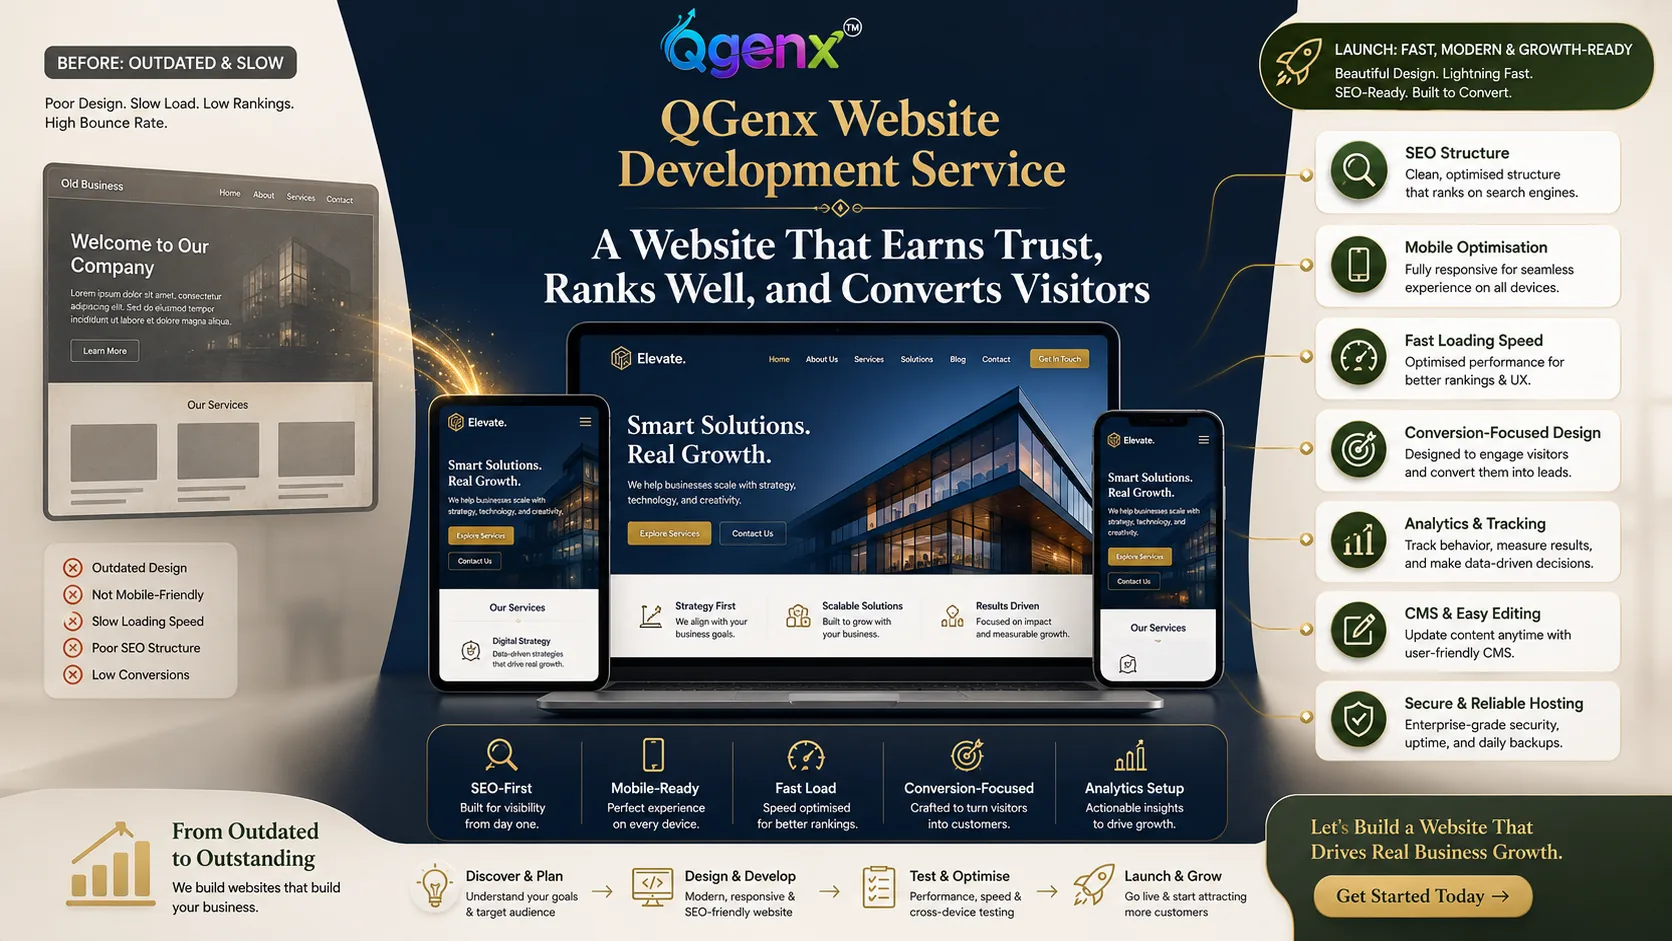
200+ websites delivered · Average 2.8s page load time · SEO-first build on every project
Retail and D2C brands · Presence
QGenx designs, delivers, validates and maintains scheduled business reports so leaders receive accurate, decision-ready numbers without manual report building.
↳ Accurate reports, on schedule, without the manual work.
Define the report layout, sections and metrics around the decision it needs to support.
Pull from spreadsheets, POS, ERP, CRM, finance exports or APIs.
Send reports daily, weekly or monthly without manual export work.
Deliver outputs in the format leaders and teams already use.
Add basic controls so obviously wrong numbers are flagged before delivery.
Update reports when metrics, teams, products or data formats change.
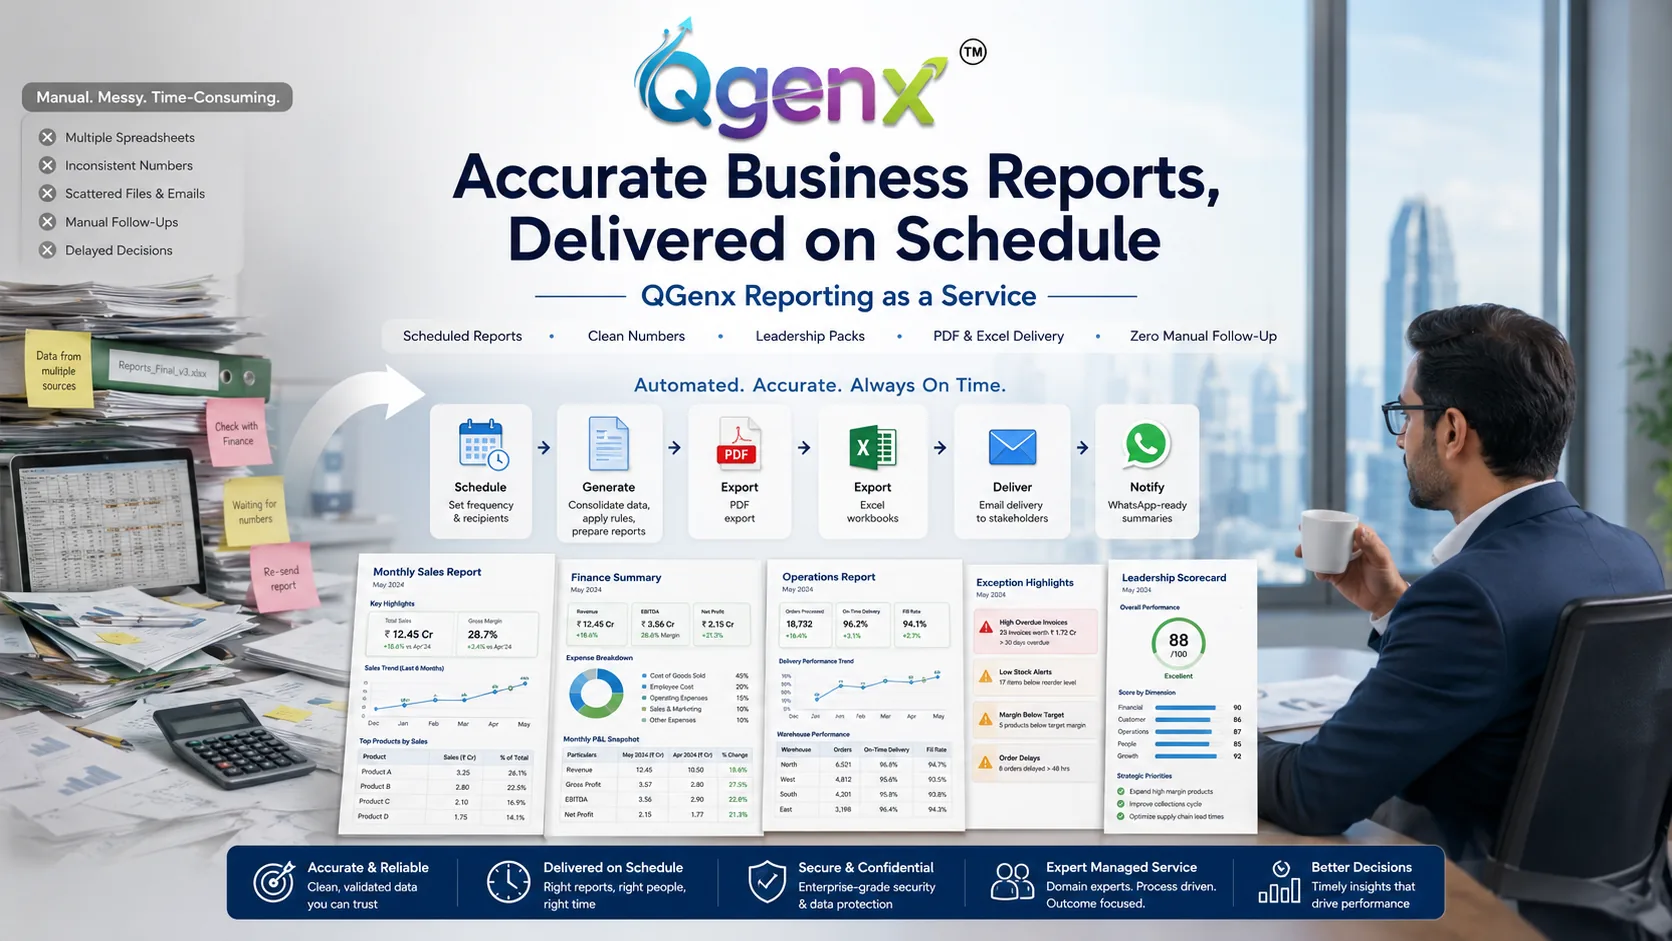
80+ report packages delivered · Delivered in 5 working days · 100% data ownership
Retail chains · Signal
QGenx takes the most error-prone finance process off your team's plate by delivering clean, exception-flagged, audit-ready reconciliation on a fixed schedule.
↳ Every number verified. Every month. Without the manhours.
Connect POS, bank feeds, payment gateways, ERP exports and marketplace data on your chosen schedule.
Categorise mismatches by timing difference, gateway delay, duplicate entry, transit loss or genuine error.
Receive reconciliation outputs daily, weekly or monthly without status chasing.
Track status, outstanding exceptions, resolution progress and historical accuracy trends.
Store inputs, outputs, exceptions and resolutions in a format auditors can work from directly.
Surface recurring gateway shortfalls, duplicate entries and systematic discrepancies.
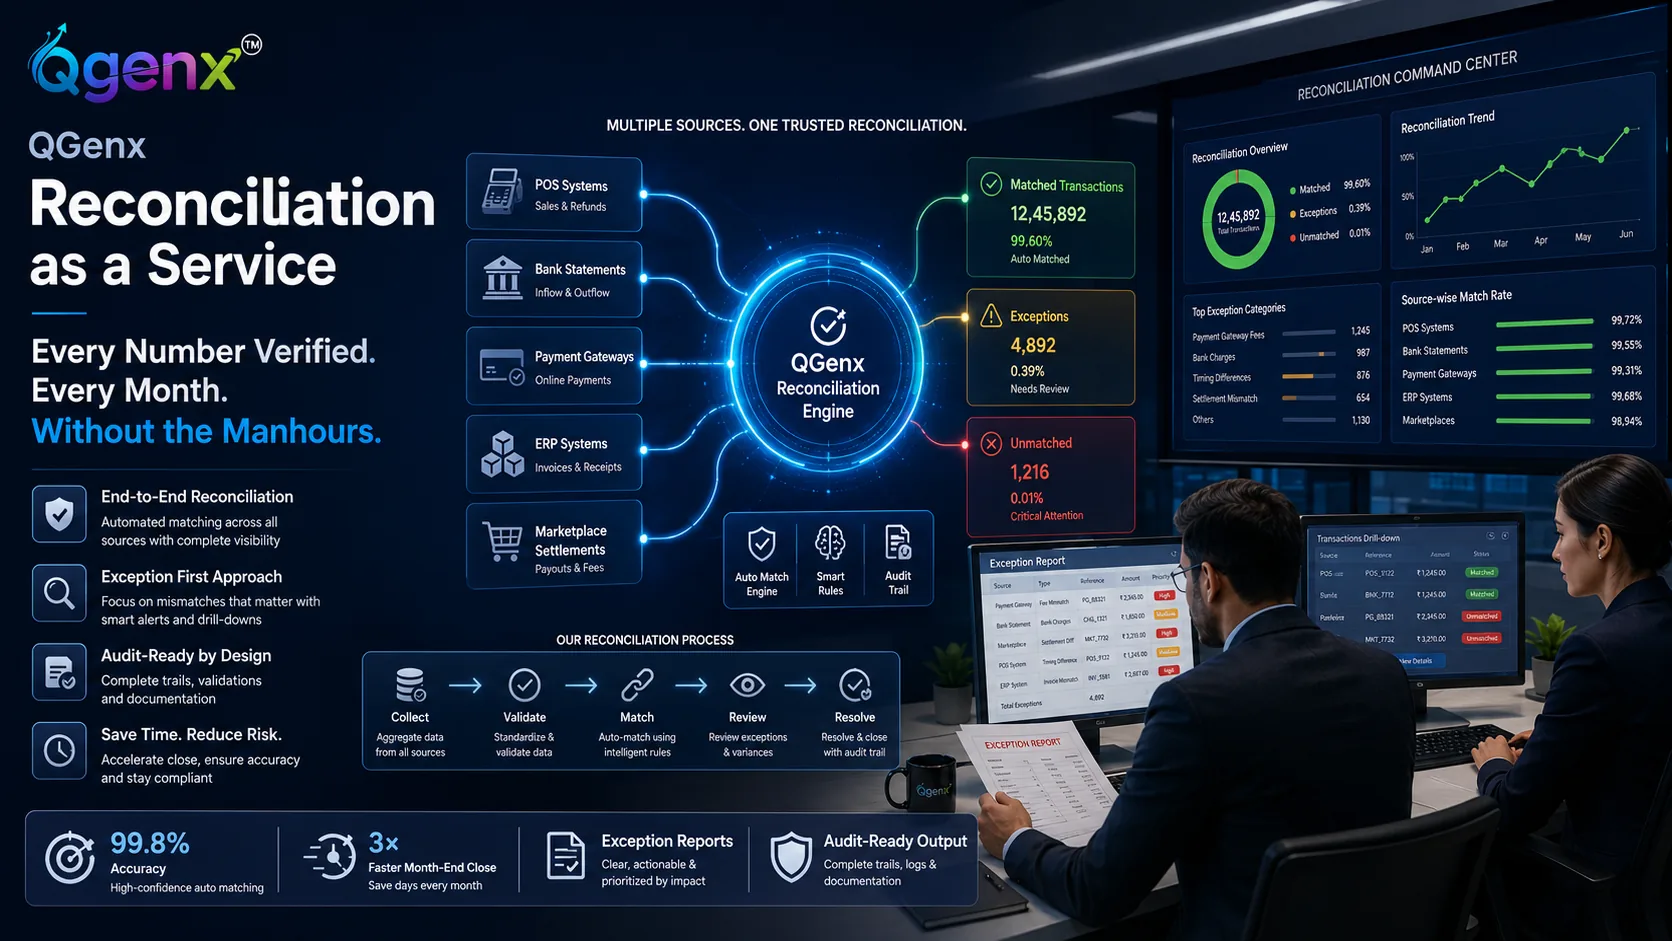
99.8% reconciliation accuracy · 3x faster month-end close · Trusted by 500+ retail and e-commerce businesses
Multi-location retail chains · Starter
The same four-stage rhythm works across dashboards, decks, data, images, websites, reports and reconciliation: clarify the business need, map the operating reality, build the artifact, then maintain the result.
One operating view for managed services, data inputs, delivery owners and recurring business outputs.
Services become easier to buy when the page shows the system behind them: input maps, output samples, QA rules, report packs, proof cards and ownership ledgers.
Show spreadsheet chaos on one side and managed output on the other.
Preview a dashboard page, report cover, slide deck, image manifest or reconciliation exception list.
Show turnaround, QA, access control, revision rounds and ownership clearly.
Let users choose their pain: messy data, poor deck, manual reports, slow website or reconciliation gaps.
Start with the workflow that repeats most often and consumes the most manual effort: reporting, dashboards, reconciliation, presentation updates, data cleanup, website improvements or image operations.
Yes. Dashboards, reporting, data, reconciliation and websites can connect naturally to QGenx products where the workflows overlap.
QGenx starts with a short brief, maps inputs and outputs, confirms the delivery model, builds the first artifact and then sets a maintenance rhythm.
Yes. QGenx can use WhatsApp or similar messaging for briefs, reminders, approval nudges and operational follow-up where quick message delivery improves adoption.
Both exist in the ecosystem. This page focuses on managed services where QGenx owns a recurring business output, not only a software screen.
Yes. Most services are designed to fit around existing POS, ERP, CRM, accounting tools, spreadsheets, drives and communication habits.
Some are one-time sprints, but most are strongest as recurring managed services where output quality improves over time.
The client owns the underlying data, business materials and delivered files unless a separate agreement says otherwise.
Pick the business problem: dashboards, presentations, data, images, websites, reports or reconciliation. The next step is a short audit and a clear delivery plan.